> ## Documentation Index
> Fetch the complete documentation index at: https://docs.curator.interworks.com/llms.txt
> Use this file to discover all available pages before exploring further.
# Activity
> Monitor content views, unique viewers, and user engagement trends from the Activity page in Curator.
export const BackendNavPath = ({levelOne, levelTwo, levelThree, tab, section}) => {
const levels = [levelOne, levelTwo, levelThree].filter(Boolean);
const lastLevel = levels.length ? levels[levels.length - 1] : '';
return
In the backend of Curator using the left-hand navigation,
navigate to the
{levelOne && {" " + levelOne}}
{levelOne && levelTwo && " > "}
{levelTwo && {levelTwo}}
{levelTwo && levelThree && " > "}
{levelThree && {levelThree}} page.
{(tab || section) && <>
{" "}On the {lastLevel} page
{tab && <> click the {tab} tab}
{tab && section && " and"}
{section && <> expand the {section} section}.
}
;
};
The Activity page provides administrators with an at-a-glance view of how users are engaging with content
in Curator. It displays charts covering view trends, top content, most active users, and day-of-week
patterns — all of which respond to a shared set of filters.
The Activity page is available to backend administrators who have been granted at least one core
Curator permission — for example, **Manage Curator Settings**. See
[Backend Administrator Permissions](/site_administration/backend_administrators/permissions)
for the full list of permissions and what each one controls.
## Tracked Metrics
 ### Total Views
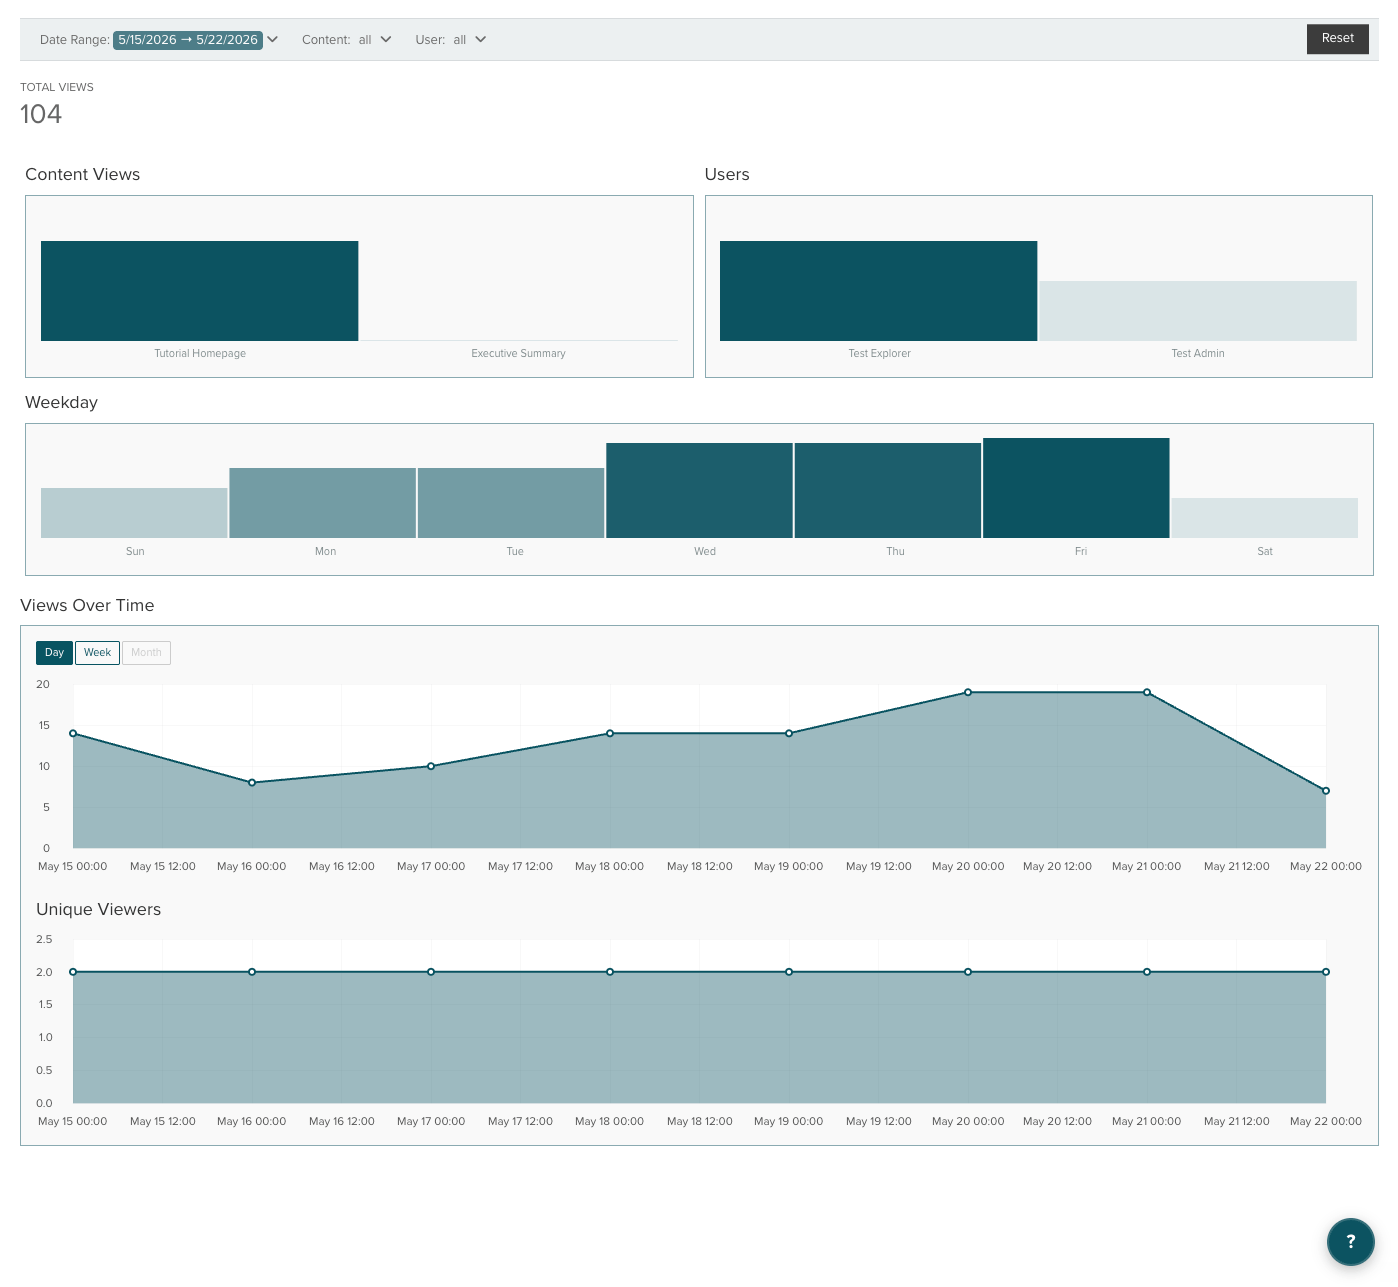
A scoreboard at the top of the page displays the **Total Views** count that matches the current filters.
This number updates whenever a filter changes.
### Views Over Time
Two line charts show how views are distributed over time:
1. **Views Over Time** — The total number of content views per time period.
2. **Unique Viewers** — The number of distinct users who viewed content per time period.
Use the **Day**, **Week**, and **Month** buttons above the chart to change the aggregation level. The Week
option requires at least 7 days of data in the selected range, and Month requires at least 30 days. If a
range is too short for an aggregation level, the button is disabled.
### Content Views
A horizontal bar chart displays the top 25 most-viewed content items. Each bar label includes the content
type (for example, "Sales Overview — Tableau Dashboard" or "Company Handbook — Page").
Bars are shaded from light to dark based on view count, making it easy to spot the highest-traffic items
at a glance.
Click a bar or its legend row to filter all charts to that content item. Click the same item again to
remove the filter.
### Users
A horizontal bar chart shows the top 10 users by total view count. When a content item is selected in the
Content Views chart, this chart narrows to show only users who viewed that item.
Click a user bar to filter all charts to that user. Click the same user again to remove the filter.
### Weekday
A bar chart shows how views are distributed across the days of the week (Monday through Sunday). This
chart respects all active filters, so you can see day-of-week patterns for a specific content item, user,
or date range.
## Filtering the view
The filter bar at the top of the page lets you narrow every chart to a specific time period, content item,
or user. All charts update automatically when a filter changes.
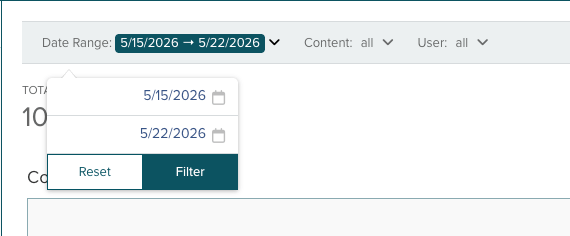
* **Date Range** — Select a start and end date. When no date range is set, the page defaults to the last
30 days of activity.
### Total Views
A scoreboard at the top of the page displays the **Total Views** count that matches the current filters.
This number updates whenever a filter changes.
### Views Over Time
Two line charts show how views are distributed over time:
1. **Views Over Time** — The total number of content views per time period.
2. **Unique Viewers** — The number of distinct users who viewed content per time period.
Use the **Day**, **Week**, and **Month** buttons above the chart to change the aggregation level. The Week
option requires at least 7 days of data in the selected range, and Month requires at least 30 days. If a
range is too short for an aggregation level, the button is disabled.
### Content Views
A horizontal bar chart displays the top 25 most-viewed content items. Each bar label includes the content
type (for example, "Sales Overview — Tableau Dashboard" or "Company Handbook — Page").
Bars are shaded from light to dark based on view count, making it easy to spot the highest-traffic items
at a glance.
Click a bar or its legend row to filter all charts to that content item. Click the same item again to
remove the filter.
### Users
A horizontal bar chart shows the top 10 users by total view count. When a content item is selected in the
Content Views chart, this chart narrows to show only users who viewed that item.
Click a user bar to filter all charts to that user. Click the same user again to remove the filter.
### Weekday
A bar chart shows how views are distributed across the days of the week (Monday through Sunday). This
chart respects all active filters, so you can see day-of-week patterns for a specific content item, user,
or date range.
## Filtering the view
The filter bar at the top of the page lets you narrow every chart to a specific time period, content item,
or user. All charts update automatically when a filter changes.
* **Date Range** — Select a start and end date. When no date range is set, the page defaults to the last
30 days of activity.
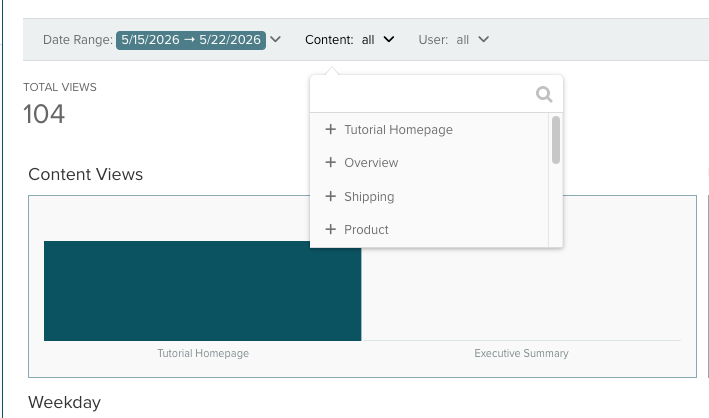
 * **Content** — Filter to a specific content item. The dropdown lists the 100 most-viewed items across all
content types.
* **Content** — Filter to a specific content item. The dropdown lists the 100 most-viewed items across all
content types.
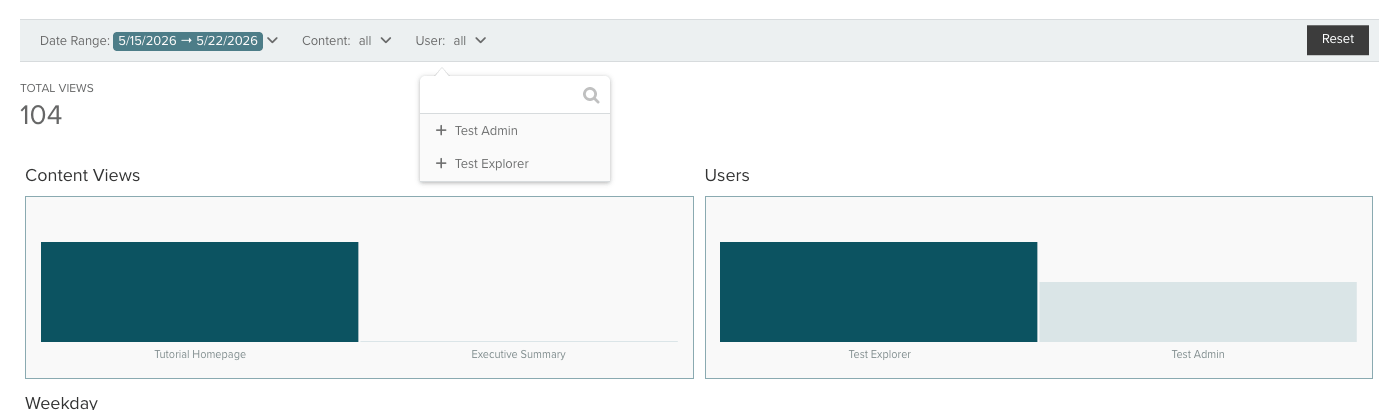
 * **User** — Filter to a specific user to see only their activity.
 Click the **Reset** button to clear all active filters and return to the default view.
## Cross-Chart Filtering
The Content Views and Users charts act as interactive filters. Clicking a content item or user in either
chart applies that selection as a filter across the entire page — the trend lines, scoreboard, and all
other charts update to reflect the selection. This makes it easy to drill down into how a particular
Dashboard is used or how an individual user engages with content.
Click the **Reset** button to clear all active filters and return to the default view.
## Cross-Chart Filtering
The Content Views and Users charts act as interactive filters. Clicking a content item or user in either
chart applies that selection as a filter across the entire page — the trend lines, scoreboard, and all
other charts update to reflect the selection. This makes it easy to drill down into how a particular
Dashboard is used or how an individual user engages with content.