

Adding a Metric to Curator
Create a new Metric
- Navigate to the backend of the system (e.g. http://curatorexample.com/backend) and log in if prompted.
- Navigate to Tableau > Metrics.
- Click on the “New Metric” button.
- Select the respective Tableau Server and Site drop-downs.
- Set the Metric Definition dropdown to “Create New”, then select the Project and Data Source you’d like to use.
- Fill out the Definition selections in the Details tab to follow the specific metric.
- Be sure to save!
Add an existing Metric (already created on Tableau Pulse)
- Navigate to the backend of the system (e.g. http://curatorexample.com/backend) and log in if prompted.
- Navigate to Tableau > Metrics.
- Click on the “New Metric” button.
- Select the respective Tableau Server and Site and Metric Definition drop-downs.
- Confirm the Definition selections in the Details tab to follow the specific metric.
- Be sure to save!
Embedding a Metric in Curator
By default, Metrics will have their own standalone pre-built template page that you can link to - this link can be found on the edit-Metric page in the backend.Adding a Metric to a page
In addition to Curator’s standalone templates, you can also add metrics to pages along side other content like images, forms, Tableau Dashboards and even other metrics. To add a metric to a page:- Navigate to the backend of the system (e.g. http://curatorexample.com/backend) and log in if prompted.
- Navigate to Content > Pages.
- Either find your page in the list you want to add your metric to or click ”+ New Page” to create a new page.
- Hover over the area of the page you’d like to add the Metric to, or click an element and click the “Change Element”
button to display the element selection options. Then select the Analytic Elements tab and click on “Tableau Metric”:
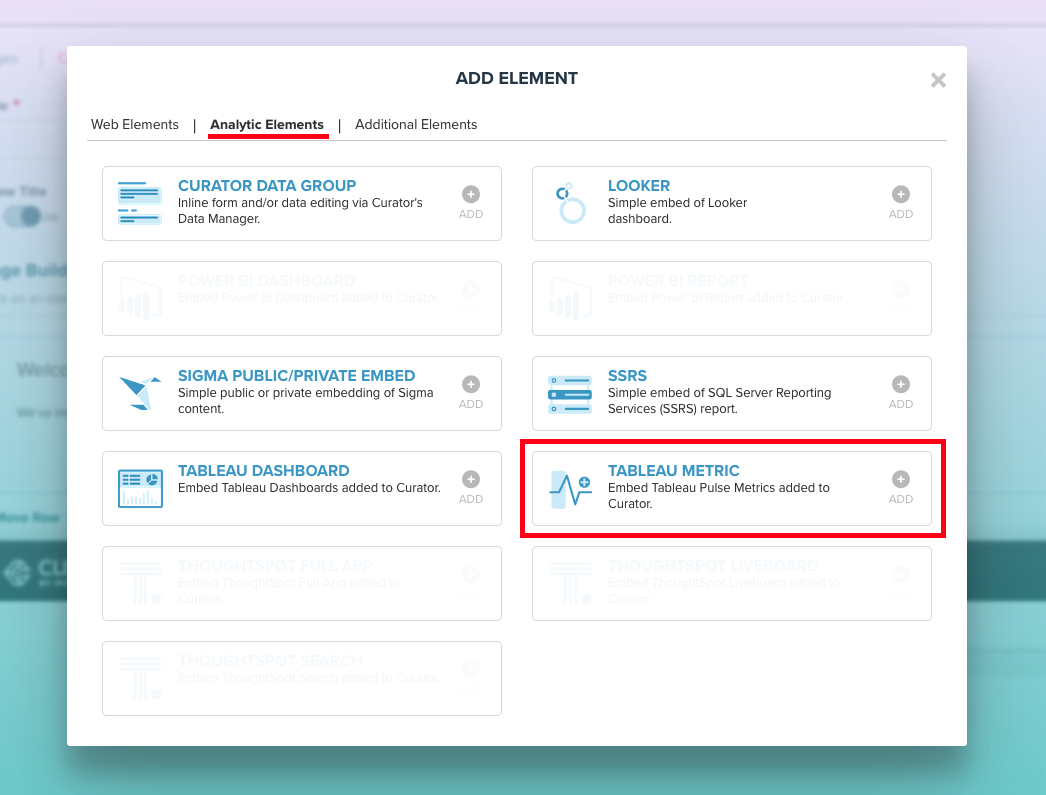
- Use the left-hand Page Styles controls to select the metric you want to embed.
- Be sure to save!
Supported Features
When a Pulse Metric is embedded in Curator, the following interactive features are available to end users:- Headline stat with comparison — displays the current metric value along with the relative percentage and absolute change versus the prior period, plus the time-period range it covers.
- Sparkline trend chart (Overview) — an inline Vega-Lite trend visualization rendered alongside the headline stat.
- Dimension/breakdown toggle — users can switch between an Overview (trend) view and a Breakdown (dimension-level bar) view using the Show Breakdown / Show Overview button.
- Guided insight text — textual insights generated by Tableau that explain metric changes (e.g., “Revenue is up 25%”).
- Favorite/bookmark — users can mark a metric as a favorite so it appears in their favorites.
- Email digest — users can immediately send or subscribe to email digests that include the headline stat and trend image.
Limitations
The following Tableau Pulse features are not currently available in Curator’s embedded metric experience:- Ask Questions — the natural language query interface available in native Tableau Pulse is not supported.
- Top Insights / Springboard — exploratory insights beyond the anchor and breakdown views are not rendered on the page.
- Dynamic filtering — end users cannot add or modify filters; only the pre-configured allowed dimensions (set at authoring time in Tableau) are applied.
- Custom time periods — the metric’s granularity, time comparison, and range are fixed in its definition (configured in Tableau / when creating the Metric) and cannot be changed by end users while viewing the page.
- Real-time refresh — insights are fetched once when the page loads; there is no live refresh or user-driven data update on demand.